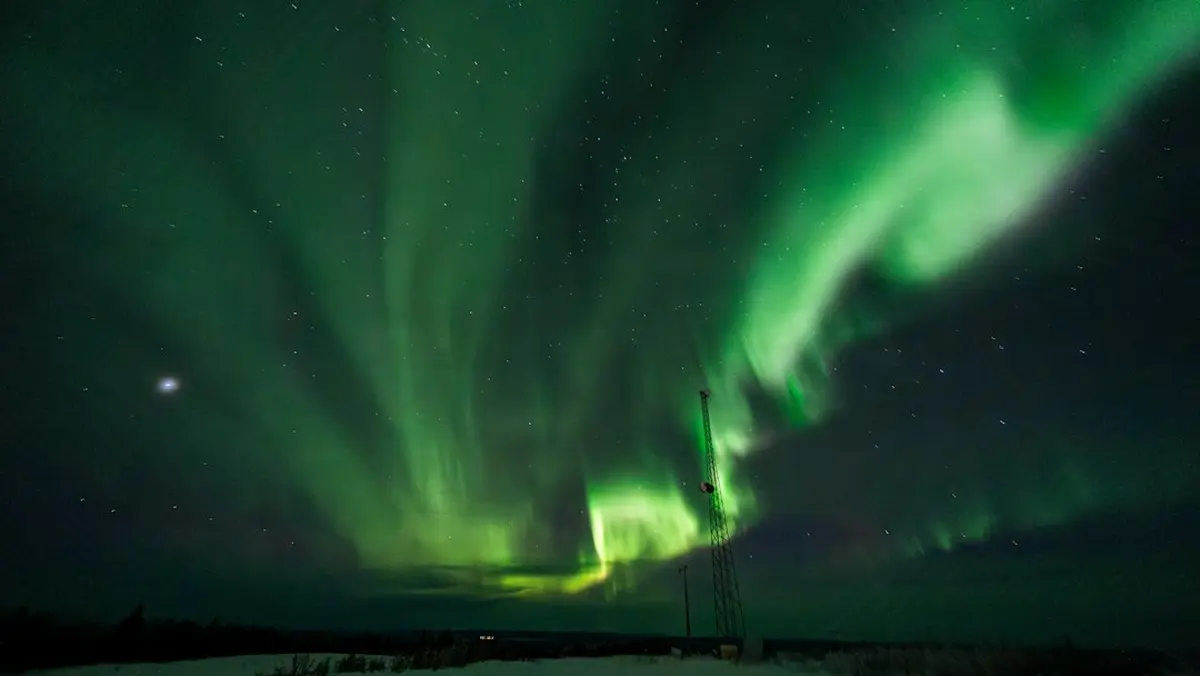
If you are standing in Fairbanks tonight with a Kp forecast open on your phone, the number is not the thing that decides your night. Cloud cover is. Fairbanks sits close enough to the auroral oval that a viewing guide covering the state reports regular sightings at Kp 2 to 3, which is a level the Geophysical Institute at the University of Alaska Fairbanks showed on most nights in mid to late September 2026. In Anchorage the number matters much more, because you are watching from south of the oval and need it to stretch toward you.
This page is for travelers and residents who want to know what the Alaska aurora forecast is measuring, which of the four or five tools to open at which point in a trip, and where each one stops being useful. It covers the UAF Geophysical Institute forecast, NOAA's Aurora Dashboard and its tonight/tomorrow-night viewline product, NOAA's 30-minute OVATION forecast, and how all of those differ from a live camera.
The thing most people get wrong is treating the Kp index as a visibility forecast for their own town. It is not. Kp is a single planetary number, averaged over three hours, built from magnetometer readings at stations sitting between 44 and 60 degrees geomagnetic latitude, well south of Interior Alaska. NOAA's own Planetary K-index page describes it as "an integer in the range 0-9 with 1 being calm and 5 or more indicating a geomagnetic storm." It tells you how disturbed Earth's magnetic field is globally. It does not know where you are standing, whether the sky above you is clear, or whether the moon is up.
What the Kp number measures, and what it does not
Kp comes from the German Kennziffer, meaning characteristic digit, and the index was introduced by the geophysicist Julius Bartels in 1938. It is derived from the maximum fluctuation of the horizontal component of Earth's magnetic field recorded on a magnetometer during a three-hour window. NOAA averages standardized readings from 13 observatories, with eight primary stations feeding the index: Sitka in Alaska, Meanook and Ottawa in Canada, Fredericksburg in Virginia, Hartland in the UK, Wingst and Niemegk in Germany, and Canberra in Australia. The result is published eight times a day.
Two consequences follow, and both change how you should read a forecast.
First, the only Alaska station in that network is Sitka, in the Panhandle. Kp is a planetary average, not a measurement of the sky over the Interior. For local, real-time data the Geophysical Institute runs its own magnetometer chain across Alaska, the GIMA array, alongside all-sky cameras at multiple sites in the state.
Second, a three-hour average smooths out exactly the thing you are trying to catch. Aurora arrives in substorms that brighten and collapse in minutes. A night that averages Kp 3 can contain a twenty-minute display overhead and two hours of nothing. This is why a modest forecast number is not a reason to stay in, and a high one is not a guarantee of a show at the moment you look up.
What Kp does predict reliably is how far from the poles the aurora reaches. NOAA's aurora viewing guidance puts the equatorward edge of the auroral oval near 66 degrees magnetic latitude at Kp 0, moving roughly 2 degrees of magnetic latitude per Kp step, down to about 48 degrees at Kp 9. The Geophysical Institute places the band of most frequent aurora at about 67 to 68 degrees geomagnetic latitude. Raise Kp and that band expands outward and brightens: NOAA describes Kp 0 to 2 as distant and dim, Kp 3 to 5 as brightening and spreading equatorward, Kp 6 to 7 as "quite bright and active" and reaching the northern US border, and Kp 8 to 9 as very bright and very active, potentially overhead in northern states.
Those same values drive NOAA's geomagnetic storm scale, which is worth knowing only so you can ignore it in the right way. On NOAA's space weather scales, Kp 5 is a G1 minor storm, Kp 6 a G2, Kp 7 a G3, Kp 8 a G4 and Kp 9 a G5. Those categories were built for power grid, satellite and radio operators. In Alaska, G1 is not the threshold at which the aurora starts. It is the threshold at which the aurora starts being visible a long way south of you.
Which forecast to open, and when
There are three official forecast products in regular use for Alaska, and they answer different questions. Use the UAF page to pick a night, the NOAA nightly oval to see how far south the aurora may sit, and the 30-minute forecast to decide whether to stay out. All three are free.
| UAF Geophysical Institute forecast (gi.alaska.edu) | NOAA Aurora Dashboard, tonight and tomorrow (spaceweather.gov) | NOAA 30-minute OVATION forecast (spaceweather.gov) | |
|---|---|---|---|
| What it gives you | Kp for the next three nights, a 1-hour real-time display, a 27-day outlook, animated hemisphere maps and live all-sky camera feeds from Alaska sites | A green oval over North America for tonight and tomorrow night that shifts to red at higher forecast intensity, plus current R, S and G scale conditions, 24-hour observed maximums, solar wind and radio flux readings | A map of where the oval is predicted to sit within the next 30 minutes, for both hemispheres, with a 24-hour activity history |
| Lead time | Three nights, plus a 27-day outlook based on the sun's rotation period | Two nights | 30 to 90 minutes |
| Update cadence | Underlying data supplied by NOAA SWPC and updated daily around noon UTC | Driven by SWPC's daily 3-day geomagnetic forecast, which is reissued at least once a day | Continuous, as new solar wind data arrive from the L1 spacecraft position |
| Data behind it | NOAA SWPC forecast data, cross-checked locally against the Geophysical Institute's GIMA magnetometer array and cameras in Alaska | The OVATION model, developed at Johns Hopkins University Applied Physics Laboratory, fed by the 3-day geomagnetic forecast and using the maximum forecast Kp between 6 pm and 6 am US Central Time for each night | OVATION driven by real-time solar wind velocity and interplanetary magnetic field measured at L1, about 1.6 million km upstream of Earth |
| Geographic detail | Alaska-centered, with camera sites in the state for direct visual confirmation | North America, oval position and color only; the southernmost-visibility line was removed from this experimental product as of May 2026 | Hemisphere-wide oval position and intensity, no city-level output |
| Use it for | Choosing which of the next three nights to drive out, and which Alaska camera to watch before you commit | Judging whether a night is a normal Interior night or one that reaches Southcentral and further south | Deciding, at 11 pm, whether to keep standing outside or go to bed |
| Wrong for | Knowing what the sky is doing in the next ten minutes, and it carries no cloud forecast | Deciding whether your exact location is inside the visible zone, since the line that used to say so is gone | Any planning beyond the next hour and a half, including booking a trip |
NOAA's Aurora Dashboard bundles the nightly oval, the 30-minute forecast and the live storm-scale readouts on one page, which is the efficient way to check two of the three products at once. It is labeled experimental, and the May 2026 removal of the viewline from the tonight/tomorrow product is a reminder that what the page shows can change between your trips.
Live cameras and third-party trackers sit in a fourth category. A camera tells you what is happening over that camera right now, including whether it is overcast there, which no forecast product will tell you. It is not a prediction. Treat it as ground truth for one point on the map, and use it to sanity-check a forecast rather than replace it. If you want a phone tool that pushes alerts rather than a page you refresh, we have looked at what the aurora apps get right and where their alert thresholds mislead.
Reading tonight's forecast, step by step
This is the sequence that works, in the order the decisions come up: weeks out, then days out, then the night itself. Total time on the night is about five minutes, and most of it is spent on weather rather than space weather.
-
A Kp figure for each candidate night
From the UAF Geophysical Institute three-day forecast or NOAA's 3-day geomagnetic forecast, which publishes Kp in 3-hourly steps.
-
A local cloud forecast for the site you intend to drive to
None of the aurora products include one. The Geophysical Institute states plainly that local sky conditions can differ significantly from the broad Kp-based prediction.
-
The moon phase for that night
NOAA notes that full moonlight reduces the apparent brightness of the aurora against the sky.
-
A site with an unobstructed view to the north, away from town lights
NOAA recommends elevated ground such as a hilltop and an open northern horizon.
-
A plan to be outside between about 10 pm and 2 am
NOAA gives that window as the usual alignment of darkness and activity, within an hour or two of midnight.
-
A way to load the 30-minute forecast from where you park
If there is no signal at your site, check it before you leave the last cell coverage and accept that you are then flying blind for the rest of the night.
1. Pick your dates against the season, not the forecast. No forecast reaches far enough ahead to help you book. The Geophysical Institute publishes a 27-day outlook built on the sun's roughly 27-day rotation period, which lets recurring active regions be anticipated as they come back around to face Earth. Use it to know what the sun has been doing, not to pick a Tuesday three weeks out. Time cost: five minutes, once.
2. Confirm you are inside the dark season. An Alaska viewing guide puts the practical window at about August 21 to April 21, with October through February offering the longest nights and most frequent opportunities. NOAA's own note is blunter: high-latitude locations have poor summer viewing because it does not get dark enough at night. If your trip falls in June, no Kp value rescues it.
3. Three days out, read the Kp forecast. Open the UAF Geophysical Institute aurora forecast, whose underlying data comes from NOAA SWPC and updates daily around noon UTC, or go to NOAA's 3-day geomagnetic forecast for the 3-hourly deterministic Kp values and the probabilistic breakdown across four activity categories. What it looks like when it worked: a number per night, and for the 3-hourly product a sense of which part of the night is forecast to be strongest. In mid to late September 2026 the Geophysical Institute page was showing values ranging from 2 to 5, with Kp 5 forecast around September 16 and 17 and again for September 24 to 26. Time cost: two minutes.
4. Compare the number to the threshold for where you will actually stand. In the Interior, Kp 2 to 3 is a go. In Southcentral, Kp 3 to 5 is the range at which displays are reported clearly. Anything at Kp 5 or above, per the Geophysical Institute's note on the September 2026 forecasts, pushes the oval south of its typical position over Fairbanks and into parts of Southcentral and even Southeast Alaska. Those city-level thresholds come from a viewing guide rather than from NOAA or UAF, which is worth knowing: neither government source publishes a Kp-to-town lookup table, and the underlying physics they do publish is stated in degrees of magnetic latitude, not place names.
5. Overlay the cloud forecast and drop nights that fail it. This is the step that changes outcomes. A clear Kp 2 night in the Interior beats an overcast Kp 5 night every time, and you cannot see through a deck of stratus regardless of what the oval is doing. If your chosen night is socked in and the next one is clear at Kp 3, take the clear one.
6. On the night, look at the nightly oval once. The tonight and tomorrow night product renders the aurora as a green oval centered on the magnetic pole, turning red where higher intensity is forecast. Remember what it is built from: the maximum forecast Kp between 6 pm and 6 am Central Time for that night, which means it is a single headline figure for a twelve-hour span. It will not tell you when.
7. Once it is dark, switch to the 30-minute forecast and refresh it. NOAA's 30-minute aurora forecast runs OVATION, the model developed by Patrick Newell at the Johns Hopkins Applied Physics Laboratory, on live solar wind velocity and magnetic field readings taken at L1, roughly 1.6 million km upstream of Earth. That upstream vantage is what buys the 30 to 90 minutes of lead time. What it looks like when it worked: the oval intensifying over your longitude while you still have time to get to your site. Refresh every 30 minutes rather than every five.
8. Cross-check with a camera before you commit to a long drive. The Geophysical Institute's all-sky cameras at multiple Alaska sites, and its 1-hour real-time display, let you compare the number against what a lens is seeing. If the nearest camera shows a flat gray frame, that is cloud, and no amount of Kp will change it.
9. Stay out through the window rather than checking once. Plan on the 10 pm to 2 am block. Substorms arrive and fade inside a three-hour Kp interval, so the failure mode is not a bad forecast, it is going inside at 11:30. Standing still for two or three hours in Interior Alaska is the part of the night that actually hurts, which is why we tested battery-heated jackets for static waiting rather than for hiking.
10. Face north, and look low if the number is modest. NOAA notes the aurora does not have to be overhead: "it can be observed from as much as a 1000 km away when the aurora is bright and if conditions are right." From Anchorage on a moderate night, what you are looking for is a glow on the northern horizon, not curtains at the zenith.
Where this goes wrong
Waiting for Kp 5 in Fairbanks. The mistake is importing a Lower 48 threshold. Kp 5 is the G1 minor storm line on NOAA's scale, and it is where mid-latitude viewers start paying attention. In the Interior it is an unusually good night, not the entry price. How to recognize it: you are skipping nights forecast at Kp 2 or 3. What to do: treat those as normal Interior nights and let cloud cover make the call.
Reading Kp as brightness. A Kp number is a three-hour average of magnetic disturbance from mid-latitude stations. It correlates with how far equatorward the oval reaches, not with how bright the display will be over your head at 11:15. How to recognize it: you saw Kp 4 forecast, went out for twenty minutes, saw nothing, and concluded the forecast was wrong. What to do: judge the forecast across the whole 10 pm to 2 am window.
Looking for the southern-limit line that is no longer there. The viewline, the line marking the southernmost extent of likely visibility, was removed from NOAA's experimental tonight/tomorrow product as of May 2026. If you remember a map with a line across the northern states and cannot find it, that is why. What to do: read the oval's position and color instead, and accept that it is a coarser answer.
Using the 30-minute forecast as a trip planner. It has a 30 to 90 minute horizon by design. Screenshotting a strong OVATION map at 2 am and expecting it to describe tomorrow is a category error. What to do: plan on the 3-day forecast, decide on the 30-minute one.
Trusting the nowcast during a solar wind data outage. When L1 solar wind data is missing or contaminated, SWPC substitutes "an alternative estimate of the solar wind forcing, based on the current Kp geomagnetic index" to keep OVATION running. The map keeps rendering, but it is then driven by a three-hour planetary average rather than live upstream measurements. How to recognize it: the product notes degraded input. What to do: lean harder on cameras and your own eyes that night.
Treating a camera or tracker as a forecast. A live feed is a measurement of one location at one moment. It is the best available answer to "is it happening right now over there" and no answer at all to "will it happen here at midnight."
Standing where you cannot see north. NOAA's guidance is specific: get an unobstructed view toward the north, ideally from elevated ground, and out of urban light. A spruce wall or the glow of a town will cost you more displays than a one-step difference in Kp.
Forgetting the moon. Full moonlight reduces the contrast of the aurora against the sky. A faint Kp 2 arc that would read clearly on a moonless night can wash out entirely. This is the single most common reason a correct forecast produces a disappointing night.
Cases that change the number you need
Fairbanks and the Interior. You are close to the band of most frequent aurora, which the Geophysical Institute places around 67 to 68 degrees geomagnetic latitude. A viewing guide covering the state reports regular Interior sightings at Kp 2 to 3, and describes Kp 3 to 4 as good activity across the Interior. Your limiting factor is weather and darkness, not Kp.
Anchorage and Southcentral. You are watching from outside the usual oval, and the same guide puts the practical range at Kp 3 to 5 for a clear view against the northern sky. Two things follow. You need the oval to expand toward you, and you should be looking low on the northern horizon rather than overhead, since a bright aurora can be seen from as much as 1,000 km away.
Southeast Alaska. Sitka is one of the eight primary magnetometer stations feeding the global Kp index, which is a nice piece of trivia and a poor viewing guarantee. On the Geophysical Institute's September 2026 forecasts, Kp 5 was the level described as pushing the oval into parts of Southcentral and even Southeast Alaska. Below that, plan on not seeing much.
Very high latitude sites. The oval is a ring, and higher Kp moves it equatorward. When activity climbs, the most active band shifts south of its typical position over Fairbanks, which is exactly how the Geophysical Institute characterized Kp 5 in September 2026. The practical implication is that a big storm is not automatically the best night at the very top of the map, and the sources in this set do not quantify how far poleward sites lose out at a given Kp.
The equinox weeks. NOAA states that the spring and fall equinoxes tend to produce stronger geomagnetic storms and better aurora because of more favorable coupling between the solar wind and the magnetosphere, the Russell-McPherron effect. Late August and September in Alaska get the benefit of that plus returning dark nights, and March into early April can bring dramatic activity. The geometry behind the September window is worth understanding if you are choosing between a September and a January trip: the 2026 equinox falls at 00:05 UTC on September 23.
Deep winter versus shoulder season. October through February gives the longest nights and therefore the most chances per trip, even if the per-night storm odds are not elevated the way they are near the equinoxes. More hours of darkness is a real advantage and it is the one figure nobody forecasts for you.
Where the solar cycle sits. The clearest statement available in this set comes from a viewing guide rather than a government source: it describes 2026 as near the maximum of Solar Cycle 25, with peak activity falling between 2024 and 2026, and notes that even average geomagnetic nights during such a window can produce exceptional displays. The NOAA and UAF pages cited here do not put a figure on the current cycle phase, so treat the cycle framing as context rather than a number you can plan against. What is documented for the 2026 season is narrower and more useful: Geophysical Institute forecasts in mid to late September 2026 ran between Kp 2 and Kp 5, with Kp 5 flagged for September 16 to 17 and September 24 to 26.
What the tools cost and what they can tell you
All three official products are free government outputs. The Geophysical Institute forecast is published by the University of Alaska Fairbanks; the dashboard, viewline, 30-minute forecast and 3-day geomagnetic forecast are NOAA Space Weather Prediction Center products. There is nothing in this set of sources that a paid app supplies and these pages do not, other than notifications.
What these tools genuinely deliver is a three-night planning horizon at 3-hourly resolution, a two-night visual oval, and a 30 to 90 minute nowcast. NOAA archives its 3-day forecasts for the past 75 days, which is the practical way to check how a run of forecasts compared with what the sky did, if you keep notes.
What they do not deliver, and what no source here supplies: cloud cover, moon phase, hour-by-hour brightness, or any success rate expressed as a probability of seeing aurora from a named town at a given Kp. If you see a figure like that quoted, it did not come from NOAA or the Geophysical Institute. The honest summary is that the forecast narrows your choice of nights and the weather decides them.
Comments
No comments yet. Be the first to comment!
Leave a Comment